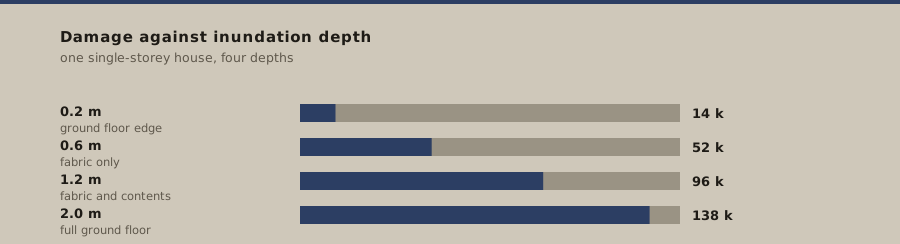
A flooded property carries a damage cost that can be estimated from its depth of inundation and its type. The estimate is used to justify projects. It excludes temporary accommodation, health effects, and the value of the time the occupants spend recovering, and those are the costs the occupants remember.
Flood damage cost per property, and what the figure leaves out
entered 2026-07-09period FY2026 · Q3 — closes 2026-09-30folio 305recast the figures above move with the periodkept by The Scupper Ledger (a named ledger, not a person)
What the curve covers
Direct damage to the building fabric and, in some curves, to contents. It is a function of depth, building type and sometimes duration. It is a well-established method and it produces figures that are consistent between studies, which is exactly what a ranking needs.
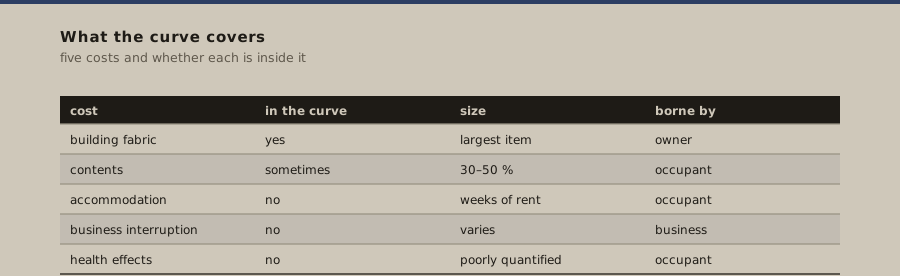
| Cost | In the curve | Typical size | Who bears it |
|---|---|---|---|
| building fabric | yes | the largest single item | owner and insurer |
| contents | sometimes | 30–50 % of fabric | occupant |
| temporary accommodation | no | weeks of rent or hotel | occupant |
| business interruption | no | varies widely | business |
| health effects | no | poorly quantified | occupant and health service |
Why the exclusions matter to the ranking

A ranking that counts only direct damage will rank a project that protects ten high-value properties above one that protects forty low-value properties, because the direct damage is what it can count. The second project may prevent far more accommodation and health cost, and none of that appears in the comparison. The ranking is not wrong; it is a ranking of one cost among several.
This is not an argument for abandoning the method. Depth-damage curves are the only tool that produces comparable figures across projects, and a ranking needs comparability more than it needs completeness. It is an argument for stating what is outside the curve, on the page, next to the figure it produces.
A damage cost is not the same as a loss. Damage is the cost of repairing what was harmed; loss is everything that followed, including the accommodation, the health effects and the time. Insurance claims are usually settled on damage, which is why the loss is systematically larger than the figure in the record.
What this entry changes
It changes what a benefit-cost ratio should be read as. A ratio computed from direct damage alone is a lower bound on the benefits of a flood-reduction project, and a project that fails the threshold on that basis may pass on a fuller accounting. The useful response is to compute the ratio on direct damage, state it, and then state separately which of the excluded costs the project would also reduce.
Documents posted to this account
- 01Risk Rating 2.0: Methodology and Data Sources (Milliman report, FEMA)supports the flood loss estimation methodology that the damage figures follow
- 02GAO-23-105977, Flood Insurance: FEMA's New Rate-Setting Methodologysupports the review of the insurance rate-setting method the loss figures are drawn from
- 03FEMA Fact Sheet - Understanding Risk Rating 2.0 (2025)supports the plain-language explanation of the risk rating method behind the figures
Each line points at one specific document, with its own title as the link text. No line is a home page and no line is a search result.
ruled off Rule it off and stop Rule it off and stop once you know what the curve covers. The figure is a lower bound, and saying so is part of the figure.