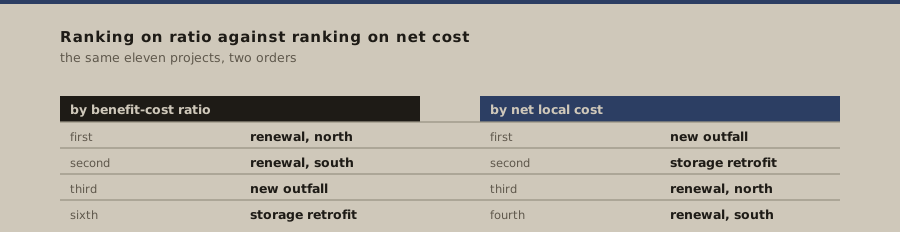
A programme of eleven projects was ranked on benefit-cost ratio. A grant became available that covered 60 % of new construction and nothing else. The ranking was recomputed on net local cost, and four projects changed places. Nothing about the projects changed.
When a grant changes the project ranking, in figures
entered 2026-06-25period FY2026 · Q2 — closed 2026-06-30folio 306kept by The Scupper Ledger (a named ledger, not a person)
What changed
Nothing about the projects. The gross costs were unchanged, the benefit-cost ratios were unchanged, and the condition grades were unchanged. What changed was the price to the local ratepayer, and that is the number a council votes on. The ranking followed the money.
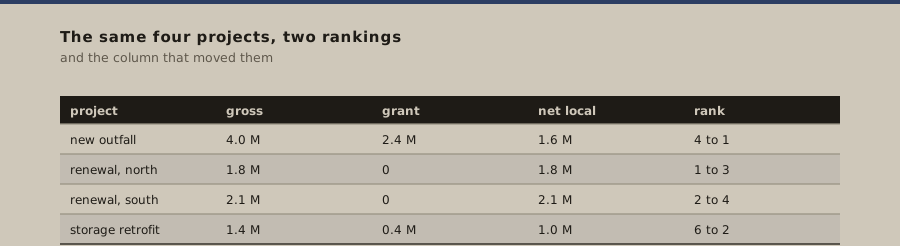
| Project | Gross | Grant | Net local | Rank change |
|---|---|---|---|---|
| new outfall | 4.0 M | 2.4 M | 1.6 M | 4 to 1 |
| renewal, north | 1.8 M | 0 | 1.8 M | 1 to 3 |
| renewal, south | 2.1 M | 0 | 2.1 M | 2 to 4 |
| storage retrofit | 1.4 M | 0.4 M | 1.0 M | 6 to 2 |
Why this is not a failure
A grant is real money and a programme that ignores it is choosing to spend local revenue that it did not have to spend. Ranking on net local cost is the correct response to a grant. The difficulty is that the grant's eligibility rules are now steering the programme, and eligibility is decided by somebody else, for reasons that have nothing to do with this system's condition.
The consequence is a programme that builds what is fundable rather than what is worst. That can be entirely the right decision, and it should be a decision rather than an outcome. A programme that ranks on net local cost and states which projects were pulled forward by eligibility is a programme that can be defended; one that quietly reorders the list is not.

A grant is not the same as a subsidy, and net local cost is not the same as total cost. A grant reduces what this jurisdiction pays; it does not reduce what the project costs. The two figures answer different questions and a programme should publish both.
What this entry changes
It changes what a capital plan should show. The useful form is two columns: the ranking on benefit-cost ratio, and the ranking on net local cost, with the projects that moved marked. That shows a council what the grant bought and what it cost in priority, and it makes the trade visible at the moment it is made rather than three years later.
Documents posted to this account
- 01Clean Water State Revolving Fund (CWSRF) 101 Fact Sheetsupports the structure of the federal loan programme a grant is compared against
- 02CWSRF 2024 Annual Reportsupports the annual report of that programme and the projects it funded
- 03Clean Water Financing Strategies Fact Sheetsupports the financing strategy guidance that the net local cost method follows
Each line points at one specific document, with its own title as the link text. No line is a home page and no line is a search result.
open Rule it off and stop Rule it off and stop once both rankings are on the page. A single ranking hides the grant.