A network grade comes from a survey of a sample of pipes, scored to a consistent scale and reported as a distribution. The distribution is the product. A single average grade describes nothing useful, because a network is either mostly sound with a few failures or mostly deteriorating, and the average hides which.
How to grade a stormwater pipe network
period FY2026 · Q3 — closes 2026-09-30folio 203recast the figures above move with the periodkept by The Scupper Ledger (a named ledger, not a person)
The four steps
The steps are mechanical and the decisions inside them are not. What counts as a grade-4 crack, and how many defects before a length moves up a grade, are conventions that have to be fixed before the first survey rather than after the results arrive.
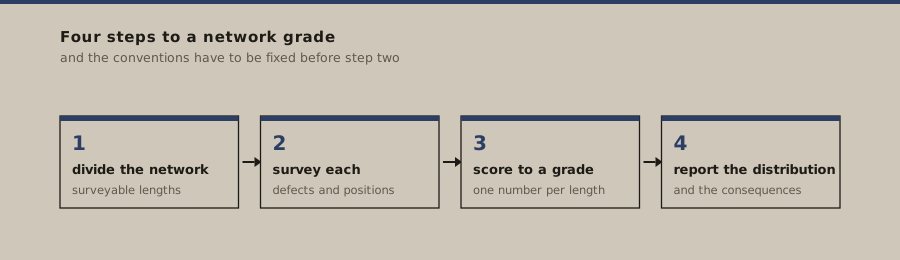
- Divide the network into lengths that can be surveyed in one pass, and number them.
- Survey each length and record every defect with its severity and its position along the pipe.
- Score the length to a single grade using the scoring system, and record the score alongside the grade.
- Report the distribution by length and by grade, and carry the consequence data separately from the grade.
The sample rule
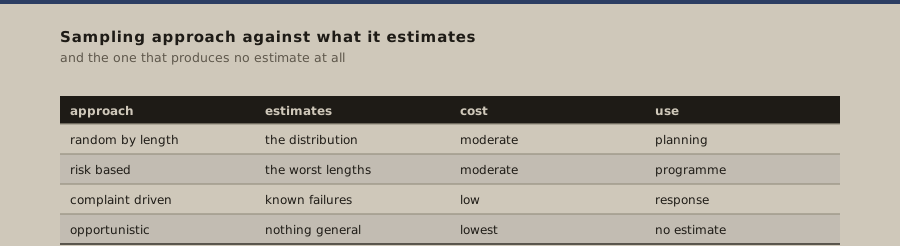
A network grade is only as good as the sample. Inspecting the pipes that have already failed gives a distribution that describes the pipes that have already failed. Inspecting a random sample gives a distribution that describes the network, and the random sample is the one that produces an estimate a council can plan against.
| Sampling approach | What it estimates | Cost | Use |
|---|---|---|---|
| random by length | the network distribution | moderate | planning |
| risk based | the worst lengths | moderate | programme |
| complaint driven | known failures | low | response only |
| opportunistic, when opened | whatever was opened | lowest | no estimate |
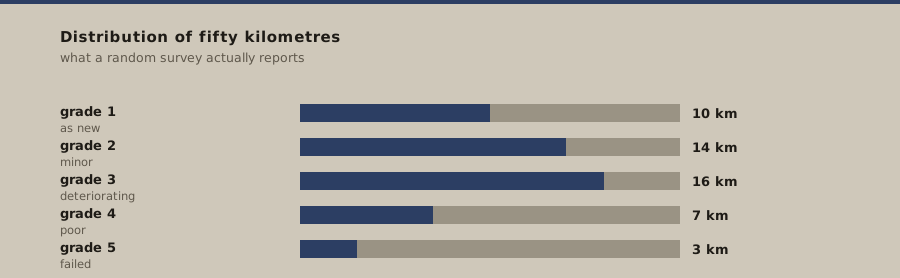
A condition grade is not a risk score, and a network distribution is not a programme. The grade says what the pipes are; the programme says what will be done and when. A distribution published without a consequence analysis is a document that will be filed and not used.
Where this posting stops
This page covers the survey and scoring. The grade scale is owned by the condition grade account, the programme it feeds by the capital plan account, and the reserve that funds it by the reserve account.
Documents posted to this account
- 01Stormwater | ASCE's 2025 Infrastructure Report Cardsupports the national infrastructure assessment that the condition context is drawn from
- 02US Stormwater Infrastructure | ASCE's 2025 Infrastructure Report Cardsupports the stormwater infrastructure chapter of that assessment
- 03ASCE 2025 Report Card for America's Infrastructuresupports the overall infrastructure report the condition figures are published in
Each line points at one specific document, with its own title as the link text. No line is a home page and no line is a search result.
ruled off Rule it off and stop Rule it off and stop once you have the distribution and the consequence data. Neither one alone is a plan.